More plotting with matplotlib
Always import matplotlib first. We will usually import it this way to use its
pyplot functionality
import matplotlib.pyplot as pltCreating a line plot
Let’s imagine we have some population data, with a set of years (our x values) and populations (our y values).
years=[1950,1955,1960,1965,1970,1980,1985,1990,1995,2000,2005,2010,2015]
population=[2.5,2.7,3.0,3.3,3.6,4.0,4.4,4.8,5.3,5.7,6.1,6.5,7.3]
We can plot this using plt.plot():
years=[1950,1955,1960,1965,1970,1980,1985,1990,1995,2000,2005,2010,2015]
population=[2.5,2.7,3.0,3.3,3.6,4.0,4.4,4.8,5.3,5.7,6.1,6.5,7.3]

plt.plot(years, population)
plt.show()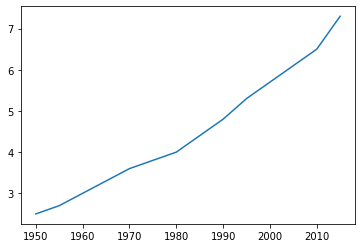
Let’s put labels on the x axis and the y axis, plus a title on the top
years=[1950,1955,1960,1965,1970,1980,1985,1990,1995,2000,2005,2010,2015]
population=[2.5,2.7,3.0,3.3,3.6,4.0,4.4,4.8,5.3,5.7,6.1,6.5,7.3]

plt.plot(years, population)
plt.ylabel("Population in Billions")
plt.xlabel("Population growth by year")
plt.title("Population Growth")
plt.show()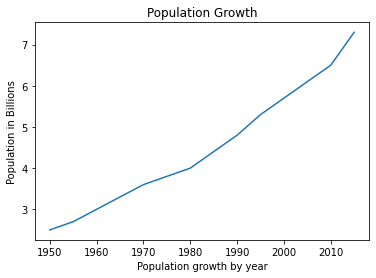
Let’s change the color of the line.
years=[1950,1955,1960,1965,1970,1980,1985,1990,1995,2000,2005,2010,2015]
population=[2.5,2.7,3.0,3.3,3.6,4.0,4.4,4.8,5.3,5.7,6.1,6.5,7.3]

plt.plot(years,population,color="firebrick")
plt.ylabel("Population in Billions")
plt.xlabel("Population growth by year")
plt.title("Population Growth")
plt.show()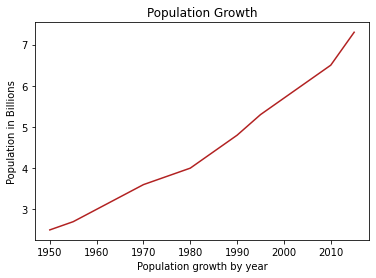
Some helpful color resources:
You can specify colors by hex value.
years=[1950,1955,1960,1965,1970,1980,1985,1990,1995,2000,2005,2010,2015]
population=[2.5,2.7,3.0,3.3,3.6,4.0,4.4,4.8,5.3,5.7,6.1,6.5,7.3]

plt.plot(years,population,color="#B200B2")
plt.ylabel("Population in Billions")
plt.xlabel("Population growth by year")
plt.title("Population Growth")
plt.show()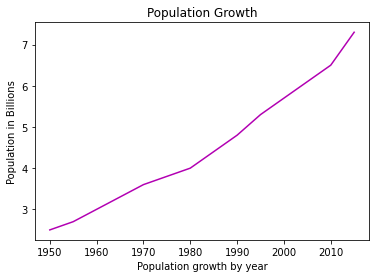
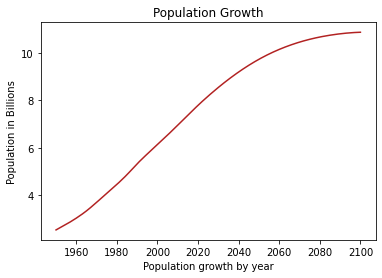
Plotting from a file
We have some world population projections in world-population.csv. This is a
file with comma-separated values. Here is the first few lines:
LocID,Location,VarID,Variant,Time,MidPeriod,PopMale,PopFemale,PopTotal,PopDensity
900,World,2,Medium,1950,1950.5,1266259.556,1270171.462,2536431.018,19.497
900,World,2,Medium,1951,1951.5,1290237.638,1293796.589,2584034.227,19.863
900,World,2,Medium,1952,1952.5,1313854.565,1317007.125,2630861.69,20.223
900,World,2,Medium,1953,1953.5,1337452.786,1340156.275,2677609.061,20.582
900,World,2,Medium,1954,1954.5,1361313.834,1363532.92,2724846.754,20.945
This data is in thousands. Let’s plot the total population in billions. Keep in mind we have to skip the first line.
We’ll do this in two steps:
- get the data from the file and store it in two lists (x, y)
- plot the data
def get_population_data(filename):
    years = []
    population = []
    with open(filename) as file:
        # skip the first line
        next(file)
        for line in file:
            location_id, location, variant_id, variant, time, mid_period,\
                male_pop, female_pop, total_pop, pop_density = line.strip().split(',')
            years.append(int(time))
            # convert to billions
            population.append(float(total_pop)/1000000)
    return (years, population)

(x, y) = get_population_data('world-population.csv')
# sanity check
print(x[0], y[0])
1950 2.536431018def plot_population_data(years, population):
plt.plot(years,population,color="firebrick")
plt.ylabel("Population in Billions")
plt.xlabel("Population growth by year")
plt.title("Population Growth")
(years, population) = get_population_data('world-population.csv')
plot_population_data(years, population)
plt.show()
Plotting multiple lines
def get_population_data(filename):
    years = []
    population = []
    male_population = []
    female_population = []
    with open(filename) as file:
        # skip the first line
        next(file)
        for line in file:
            location_id, location, variant_id, variant, time, mid_period,\
                male_pop, female_pop, total_pop, pop_density = line.strip().split(',')
            years.append(int(time))
            # convert to billions
            population.append(float(total_pop)/1000000)
            male_population.append(float(male_pop)/1000000)
            female_population.append(float(female_pop)/1000000)

    return (years, population, male_population, female_population)

(x, y, m, f) = get_population_data('world-population.csv')
# sanity check
print(x[0], y[0], m[0], f[0])
1950 2.536431018 1.266259556 1.270171462def plot_population_data(years, population, male_population, female_population):
plt.plot(years,population,color="tab:blue")
plt.plot(years,male_population,color="tab:orange")
plt.plot(years,female_population,color="tab:green")
plt.ylabel("Population in Billions")
plt.xlabel("Population growth by year")
plt.title("Population Growth")
(years, population, male_population, female_population) = get_population_data('world-population.csv')
plot_population_data(years, population, male_population, female_population)
plt.show()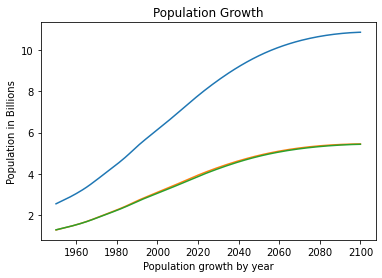
Use label in each line to indicate what data it shows. use legend() to
create a legend using these labels.
    plt.plot(years,population,color="tab:blue", label='Total Population')
    plt.plot(years,male_population,color="tab:orange", label='Male Population')
    plt.plot(years,female_population,color="tab:green", label='Female Population')

    plt.legend()
def plot_population_data(years, population, male_population, female_population):
    plt.plot(years,population,color="tab:blue", label='Total Population')
    plt.plot(years,male_population,color="tab:orange", label='Male Population')
    plt.plot(years,female_population,color="tab:green", label='Female Population')
    plt.ylabel("Population in Billions")
    plt.xlabel("Population growth by year")
    plt.title("Population Growth")
    plt.legend()
    return plt

(years, population, male_population, female_population) = get_population_data('world-population.csv')
plot = plot_population_data(years, population, male_population, female_population)
plot.show()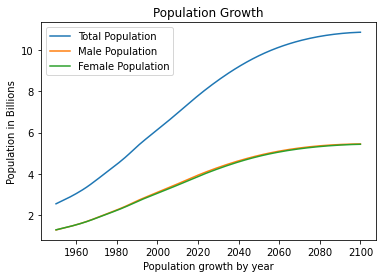
Let’s zoom in on years of interest
def plot_population_data(years, population, male_population, female_population, start_year, end_year):
    start = years.index(start_year)
    end = years.index(end_year) + 1
    years = years[start:end]
    population = population[start:end]
    male_population = male_population[start:end]
    female_population = female_population[start:end]
    plt.plot(years,population,color="tab:blue", label='Total Population')
    plt.plot(years,male_population,color="tab:orange", label='Male Population')
    plt.plot(years,female_population,color="tab:green", label='Female Population')
    plt.ylabel("Population in Billions")
    plt.xlabel("Population growth by year")
    plt.title("Population Growth")
    plt.legend()
    return plt

(years, population, male_population, female_population) = get_population_data('world-population.csv')
plot = plot_population_data(years, population, male_population, female_population, 1980, 2020)
plot.show()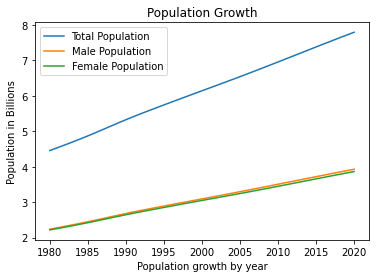
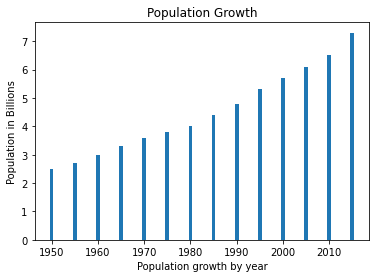
Bar Plot
Use plt.bar() to plot bars instead of a line
def plot_population_data(years, population):
    plt.bar(years,population)
    plt.ylabel("Population in Billions")
    plt.xlabel("Population growth by year")
    plt.title("Population Growth")
    return plt

years=[1950,1955,1960,1965,1970,1975,1980,1985,1990,1995,2000,2005,2010,2015]
population=[2.5,2.7,3.0,3.3,3.6,3.8,4.0,4.4,4.8,5.3,5.7,6.1,6.5,7.3]
plot = plot_population_data(years, population)
plot.show()
def plot_population_data(years, population):
    plt.bar(years,population)
    plt.ylabel("Population in Billions")
    plt.xlabel("Population growth by year")
    plt.title("Population Growth")
    return plt


(years, population, male_population, female_population) = get_population_data('world-population.csv')
plot = plot_population_data(years, population)
plot.show()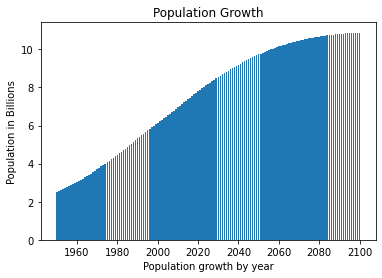
Bar plots make a lot more sense for categorical data, meaning we have data on some things that are non-sequential categories. Let’s use movie box office data from 2021:
Rank,Year,Movie,WorldwideBox Office,DomesticBox Office,InternationalBox Office
1,2009,Avatar,"$2,845,899,541","$760,507,625","$2,085,391,916"
2,2019,Avengers: Endgame,"$2,797,800,564","$858,373,000","$1,939,427,564"
3,1997,Titanic,"$2,207,986,545","$659,363,944","$1,548,622,601"
Be careful! There are commas in the amounts! And the box amounts are all stored
as strings with a $ in front!
Also! it turns out that movie names are not unique — The Lion King has a separate release in 1994 and 2019.
Let’s first write a function to convert $2,085,391,916 to an integer value.
def get_amount(amount):
    # get rid of the leading $
    amount = amount[1:]
    # replace each comma with nothing (the empty string)
    amount = amount.replace(',','')
    # convert to integer
    amount = int(amount)
    return amount

get_amount('$2,085,391,916') 2085391916In Python, we will often string together function calls. So:
def get_amount(amount):
    # get rid of the leading $, replace each comma with nothing (the empty string), convert to integer
    #return int(amount[1:].replace(',',''))
    return int(amount.strip('$').replace(',',''))

get_amount('$2,085,391,916') 2085391916Now we have to read a file that has a bunch of commas in the middle of fields:
Rank,Year,Movie,WorldwideBox Office,DomesticBox Office,InternationalBox Office
1,2009,Avatar,"$2,845,899,541","$760,507,625","$2,085,391,916"
2,2019,Avengers: Endgame,"$2,797,800,564","$858,373,000","$1,939,427,564"
3,1997,Titanic,"$2,207,986,545","$659,363,944","$1,548,622,601"
Use csv.reader() from the csv library to handle the commas.
import csv

with open('all-time-worldwide-box-office.csv') as file:
    # skip first line
    next(file)
    # each line will be a list -- all stripped and split for you
    lines = csv.reader(file)
    # get first 10 lines
    number = 0
    for line in lines:
        print(line)
        number += 1
        if number == 10:
            break
    ['1', '2009', 'Avatar', '$2,845,899,541', '$760,507,625', '$2,085,391,916']
    ['2', '2019', 'Avengers: Endgame', '$2,797,800,564', '$858,373,000', '$1,939,427,564']
    ['3', '1997', 'Titanic', '$2,207,986,545', '$659,363,944', '$1,548,622,601']
    ['4', '2015', 'Star Wars Ep. VII: The Force Awakens', '$2,064,615,817', '$936,662,225', '$1,127,953,592']
    ['5', '2018', 'Avengers: Infinity War', '$2,044,540,523', '$678,815,482', '$1,365,725,041']
    ['6', '2015', 'Jurassic World', '$1,669,979,967', '$652,306,625', '$1,017,673,342']
    ['7', '2019', 'The Lion King', '$1,654,367,425', '$543,638,043', '$1,110,729,382']
    ['8', '2015', 'Furious 7', '$1,516,881,526', '$353,007,020', '$1,163,874,506']
    ['9', '2012', 'The Avengers', '$1,515,100,211', '$623,357,910', '$891,742,301']
    ['10', '2019', 'Frozen II', '$1,446,925,396', '$477,373,578', '$969,551,818']
import csv
def get_amount(amount):
if amount == '':
return 0
return int(amount[1:].replace(',',''))/1000000000
def movie_plus_year(movie, year):
return movie + ' - ' + year
def read_movie_data(filename):
movies = {}
sorted_movies = []
with open(filename) as file:
next(file)
# each line will be a list -- all stripped and split for you
lines = csv.reader(file)
for rank, year, movie, worldwide_box, domestic_box, international_box in lines:
movieyear = movie_plus_year(movie, year)
movies[movieyear] = (get_amount(worldwide_box), get_amount(domestic_box), get_amount(international_box))
sorted_movies.append(movieyear)
return movies, sorted_movies
def plot_worldwide_box_office(movies, sorted_movies):
    worldwide_box_office = []
    for movie in sorted_movies:
        worldwide, domestic, international = movies[movie]
        worldwide_box_office.append(worldwide)
    plt.bar(sorted_movies, worldwide_box_office)
    plt.ylabel("Worldwide Box Office (billions)")
    plt.xlabel("Movie")
    plt.title("Top Grossing Movies of All Time")
    return plt

movies, sorted_movies = read_movie_data('all-time-worldwide-box-office.csv')
plot = plot_worldwide_box_office(movies, sorted_movies[:11])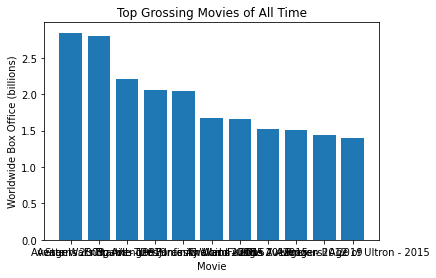
Rotate xtick labels with:
plt.xticks(rotation=90)def plot_worldwide_box_office(movies, sorted_movies):
worldwide_box_office = []
for movie in sorted_movies:
worldwide, domestic, international = movies[movie]
worldwide_box_office.append(worldwide)
plt.bar(sorted_movies, worldwide_box_office)
plt.ylabel("Worldwide Box Office (billions)")
plt.xlabel("Movie")
plt.title("Top Grossing Movies of All Time")
plt.xticks(rotation=90)
movies, sorted_movies = read_movie_data('all-time-worldwide-box-office.csv')
plot = plot_worldwide_box_office(movies, sorted_movies[:20])
plt.show()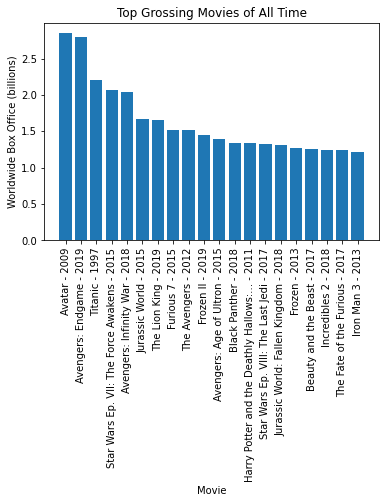
Or you can make a horizontal barplot with plt.barh()
def plot_worldwide_box_office(movies, sorted_movies):
    worldwide_box_office = []
    for movie in sorted_movies:
        worldwide, domestic, international = movies[movie]
        worldwide_box_office.append(worldwide)
    # uncomment if you want to change the figure size, in inches
    # first size is width, second is height
    # plt.figure(figsize=(4,20))
    plt.barh(sorted_movies, worldwide_box_office)
    plt.xlabel("Worldwide Box Office (billions)")
    plt.ylabel("Movie")
    plt.title("Top Grossing Movies of All Time")

movies, sorted_movies = read_movie_data('all-time-worldwide-box-office.csv')
plot_worldwide_box_office(movies, list(reversed(sorted_movies[:10])))
plt.show()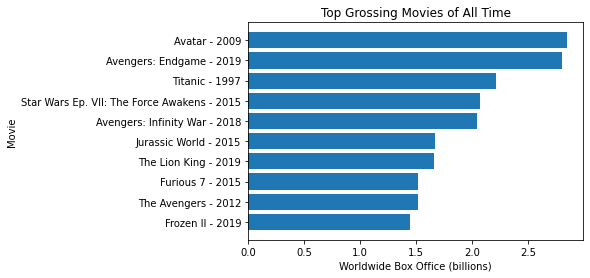
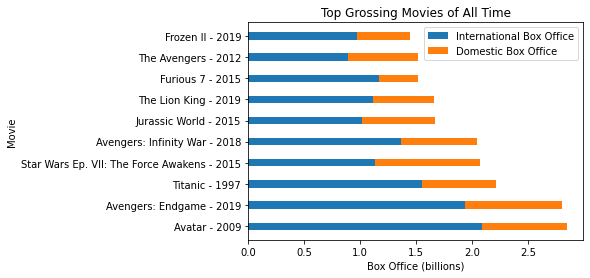
Let’s repeat this plot, but with two bars — both international and total box
office. By default, these bars will just paint one on top of each other. We will
use the left parameter to indicate that we want the domestic box office to
print to the left of the international box office.
plt.barh(sorted_movies, domestic_box_office, width, left=international_box_office, label='Domestic Box Office')The left keyword takes a list, so that there is a different left endpoint
for the bar for each movie.
def plot_worldwide_box_office(movies, sorted_movies):
    worldwide_box_office = []
    domestic_box_office = []
    international_box_office = []

    for movie in sorted_movies:
        worldwide, domestic, international = movies[movie]
        worldwide_box_office.append(worldwide)
        domestic_box_office.append(domestic)
        international_box_office.append(international)

    width = 0.35

    plt.barh(sorted_movies, international_box_office, width, label='International Box Office')
    # use left to indicate left endpoint of the bar
    plt.barh(sorted_movies, domestic_box_office, width,  left=international_box_office, label='Domestic Box Office')

    plt.xlabel("Box Office (billions)")
    plt.ylabel("Movie")
    plt.title("Top Grossing Movies of All Time")
    plt.legend()

movies, sorted_movies = read_movie_data('all-time-worldwide-box-office.csv')
plot_worldwide_box_office(movies, sorted_movies[:10])
plt.show()