Plotting with Matplotlib
matplotlib is a python library designed to make plotting easy.
It’s name comes from “Matlab Plotting Library”.
Matplotlib comes with a package named pyplot that provides a simple interface
we use most of the time.
That’s what we’ll use in this class.
import matplotlib.pyplot as pltNew syntax!
You can do this:
import matplotlib.pyplot

matplotlib.pyplot.plot([0, 1], [2, 3])

matplotlib.pyplot.plot([2, 1], [7, 3])

matplotlib.pyplot.plot([0, 2], [2, 6])

matplotlib.pyplot.plot([0, 4], [1, 3])
but that’s a lot of typing.
Instead, we can use as in our import statement to give the package a different
name in our script.
import matplotlib.pyplot as plt

plt.plot([0, 1], [2, 3])

plt.plot([2, 1], [7, 3])

plt.plot([0, 2], [2, 6])

plt.plot([0, 4], [1, 3])
I strongly recommend following the community convention of using plt as the
alias for matplotlib.pyplot.
Plotting a simple line
xx = [0, 5]
yy = [0, 5]
plt.plot(xx, yy)
[<matplotlib.lines.Line2D at 0x112bcd1f0>]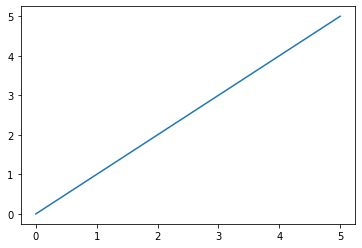
We use the plot function from matplotlib.pyplot to plot a simple line.
Because we renamed matplotlib.pyplot to plt when we imported it, we write
plt.plot().
The first argument is a list of the X coordinates, and the second argument is a list of the Y coordinates.
Plotting a multi-segment line
xx = [0, 2, 5]
yy = [0, 6, 3]
plt.plot(xx, yy)
[<matplotlib.lines.Line2D at 0x112cae9d0>]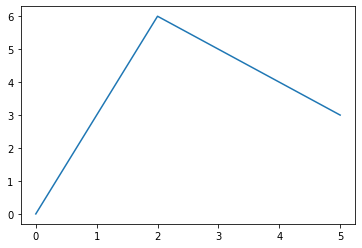
The list of X and Y coordinates can be as long as you want, but they should be the same length.
How would you plot a series of lines that go through the following points?
[(0, 0), (0, 2), (3, 3)]
Remember, plot doesn’t take a list of points.
It takes a list of X coordinates and a list of Y coordinates.
xx = [0, 0, 3]
yy = [0, 2, 3]
plt.plot(xx, yy)
[<matplotlib.lines.Line2D at 0x112d1faf0>]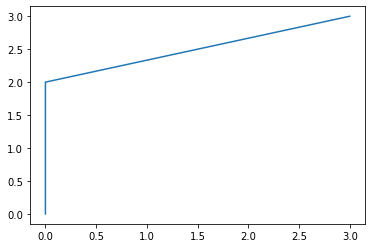
How would we write a function that could take a list of points and return two lists of coordinates?
def get_coordinates(points):
    """
    :param points: a list of tuples representing (X,Y) pairs
    :return: a list of X coordinates and a list of Y coordinates
    >>> get_coordinates([(0, 1), (2, 3), (4, 5)])
    ([0, 2, 4], [1, 3, 5])
    """
get_coordinates([(0, 1), (2, 3), (4, 5)])Make it fancy
We can add labels and a title to our plots.
plt.plot([0, 1, 2, 5], [20, 18, 15, 2])
plt.xlabel("Number of seconds after class ends")
plt.ylabel("Number of students in the classroom")
plt.title("CS 110")
Text(0.5, 1.0, 'CS 110')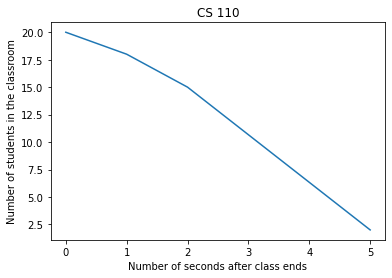
Make it colorful
We can also change the color of a line, the line style, and the line markers.
plt.plot([0, 1, 2, 5], [20, 18, 15, 2], c='green', ls="--", marker='d')
plt.xlabel("Number of seconds after class ends")
plt.ylabel("Number of students in the classroom")
plt.title("CS 110")
Text(0.5, 1.0, 'CS 110')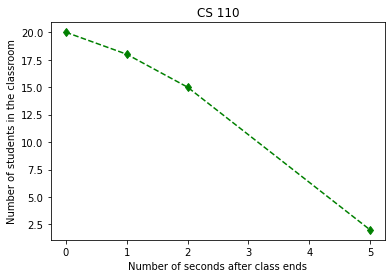
Default arguments
When you write functions that are only ever used for one thing, the parameters can typically be pretty simple.
However, when you write functions that will be used by other people for many
different things, like plot, there is a tension between giving the user lot’s
of options versus making a method that is easy to use.
Python gives us the ability to provide default values for function arguments.
This way, the users that want something simple have something simple, and the users that want to customize something can.
def print_with_bullets(text, bullet="-"):
    """Split the text on newline and print each line with a bullet in front"""

    for line in text.split('\n'):
        # Skip empty lines
        if not line.strip():
            continue
        # Print the line with a bullet in front
        print(f"{bullet} {line}")
text = """
This is some text.
When it prints it will have bullets in front.
And THAT will be awesome.
"""
print_with_bullets(text)
print()
print_with_bullets(text, bullet="●") - This is some text.
- When it prints it will have bullets in front.
- And THAT will be awesome.
● This is some text.
● When it prints it will have bullets in front.
● And THAT will be awesome.Mathematical Plotting
Let’s say we want to graph the function
How would we do that?
First we define the domain, or the values of X we want to graph.
Then we would compute the values of Y.
Then we can plot the values.
Detour: a quick review of mathematical operators
7 + 2 97 - 2 57 * 2 147 / 2 3.57 ** 2 49# Option 1
xx = [-2, -1, 0, 1, 2]
yy = []
for x in xx:
y = 2 * x**2 - 4
yy.append(y)
plt.plot(xx, yy, marker=".") [<matplotlib.lines.Line2D at 0x112e69160>]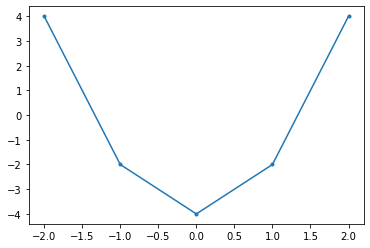
If we wanted to plot more points, it would get tedious to manually write out all the X values.
Detour: numpy
numpy is a package for doing numerical computations in python.
It’s name comes from “Numeric Python”.
We won’t go into it much in this course, but if you take math programming courses, you’ll use it extensively.
Arrays
numpy provides an array type.
It’s like a list: it is a sequence of values.
You can change items of the array (e.g. my_array[0] = 7), but it doesn’t have
an append function.
import numpy as np
my_array = np.array([1, 2, 3, 4, 5])
my_array
array([1, 2, 3, 4, 5])The brilliance behind arrays is that you can use mathematical operators on them very easily.
my_array + 1 array([2, 3, 4, 5, 6])my_array * 7 array([ 7, 14, 21, 28, 35])my_array / 9 array([0.11111111, 0.22222222, 0.33333333, 0.44444444, 0.55555556])my_array + my_array array([ 2, 4, 6, 8, 10])my_array ** 3 + my_array * 7 - 10 array([ -2, 12, 38, 82, 150])Back to Plotting
The linspace function in numpy let’s us easily generate an array of numbers.
The first argument is the starting number.
The second argument is the ending number.
The third argument is the number of evenly-spaced points to create.
np.linspace(0, 10, 10) array([ 0. , 1.11111111, 2.22222222, 3.33333333, 4.44444444,
5.55555556, 6.66666667, 7.77777778, 8.88888889, 10. ])np.linspace(0, 10, 21) array([ 0. , 0.5, 1. , 1.5, 2. , 2.5, 3. , 3.5, 4. , 4.5, 5. ,
5.5, 6. , 6.5, 7. , 7.5, 8. , 8.5, 9. , 9.5, 10. ])Notice how unlike range, the ending number is included in the array.
xx = np.linspace(-2, 2, 100)
yy = 2 * xx**2 - 4
plt.plot(xx, yy, marker='.')
# plt.xlim([0, 1])
# plt.ylim([-4, -3])
[<matplotlib.lines.Line2D at 0x1131bf580>]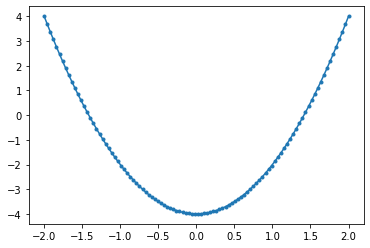
Plotting multiple lines on the same plot
xx = np.linspace(-10, 10, 101)
yy1 = np.sin(xx)
yy2 = np.cos(xx)

plt.plot(xx, yy1)
plt.plot(xx, yy2)
plt.legend(['sin', 'cos'])
plt.title("sin vs cos")
Text(0.5, 1.0, 'sin vs cos')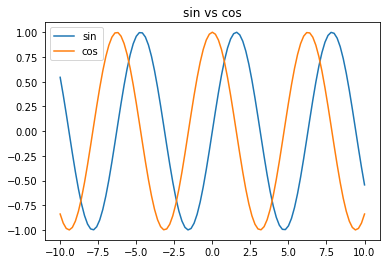
np.pi 3.141592653589793# Using np.pi
xx = np.linspace(-4 * np.pi, 4 * np.pi, 101)
yy1 = np.sin(xx)
yy2 = np.cos(xx)
plt.plot(xx, yy1)
plt.plot(xx, yy2)
plt.legend(['sin', 'cos'])
plt.title("sin vs cos")
Text(0.5, 1.0, 'sin vs cos')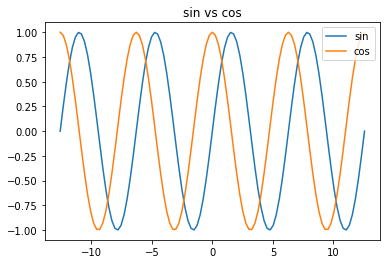
Just for fun :)
xx = np.linspace(-4 * np.pi, 4 * np.pi, 101)
yy1 = np.sin(xx)
yy2 = np.cos(xx)
yy3 = np.sin(xx+np.pi)
plt.plot(xx, yy1, lw=10, alpha=0.5)
plt.plot(xx, yy2, lw=10, alpha=0.5)
plt.plot(xx, yy3, lw=20, alpha=0.5)
plt.title("Ooohh. Pretty. :)")
Text(0.5, 1.0, 'Ooohh. Pretty. :)')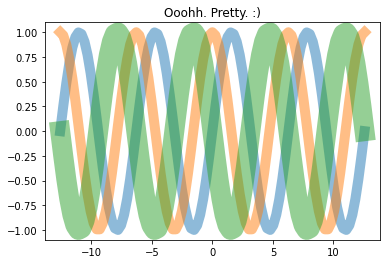
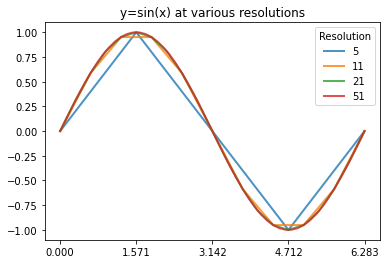
options = [5, 11, 21, 51]
for num_points in options:
    xx = np.linspace(0, 2*np.pi, num_points)
    plt.plot(xx, np.sin(xx), lw=2, alpha=0.8)
plt.legend(options, title="Resolution")
plt.xticks(np.linspace(0, 2*np.pi, 5))
plt.title("y=sin(x) at various resolutions")
Text(0.5, 1.0, 'y=sin(x) at various resolutions')