
Working with Tables
import matplotlib.pyplot as pltdef read_csv(filename):
with open(filename, 'rt') as file:
# Skip header
next(file)
# Read lines
lines = []
for line in file:
lines.append(line.strip().split(','))
return lineslines = read_csv("world-population.csv")
lines[:2] [['900',
'World',
'2',
'Medium',
'1950',
'1950.5',
'1266259.556',
'1270171.462',
'2536431.018',
'19.497'],
['900',
'World',
'2',
'Medium',
'1951',
'1951.5',
'1290237.638',
'1293796.589',
'2584034.227',
'19.863']]import csv
def read_csv(filename):
with open(filename, 'rt') as file:
reader = csv.reader(file)
# Skip header
next(reader)
lines = []
for line in reader:
lines.append(line)
return linesimport csv
def read_csv(filename):
with open(filename, 'rt') as file:
reader = csv.reader(file)
# Skip header
next(reader)
return list(reader)lines = read_csv("world-population.csv")
lines[:2] [['900',
'World',
'2',
'Medium',
'1950',
'1950.5',
'1266259.556',
'1270171.462',
'2536431.018',
'19.497'],
['900',
'World',
'2',
'Medium',
'1951',
'1951.5',
'1290237.638',
'1293796.589',
'2584034.227',
'19.863']]What if we want to return the header instead of skip it?
def read_csv(filename):
    with open(filename, 'rt') as file:
        reader = csv.reader(file)
        header = next(reader)
        lines = list(reader)
        return header, lines
header, lines = read_csv("world-population.csv")
header ['LocID',
'Location',
'VarID',
'Variant',
'Time',
'MidPeriod',
'PopMale',
'PopFemale',
'PopTotal',
'PopDensity']lines[:2] [['900',
'World',
'2',
'Medium',
'1950',
'1950.5',
'1266259.556',
'1270171.462',
'2536431.018',
'19.497'],
['900',
'World',
'2',
'Medium',
'1951',
'1951.5',
'1290237.638',
'1293796.589',
'2584034.227',
'19.863']]def read_csv(filename):
with open(filename, 'rt') as file:
reader = csv.reader(file)
return next(reader), list(reader)header, lines = read_csv("world-population.csv")
header ['LocID',
'Location',
'VarID',
'Variant',
'Time',
'MidPeriod',
'PopMale',
'PopFemale',
'PopTotal',
'PopDensity']lines[:2] [['900',
'World',
'2',
'Medium',
'1950',
'1950.5',
'1266259.556',
'1270171.462',
'2536431.018',
'19.497'],
['900',
'World',
'2',
'Medium',
'1951',
'1951.5',
'1290237.638',
'1293796.589',
'2584034.227',
'19.863']]for line in lines[:3]:
for name, value in zip(header, line):
print(f"{name}: {value}")
print() LocID: 900
Location: World
VarID: 2
Variant: Medium
Time: 1950
MidPeriod: 1950.5
PopMale: 1266259.556
PopFemale: 1270171.462
PopTotal: 2536431.018
PopDensity: 19.497
LocID: 900
Location: World
VarID: 2
Variant: Medium
Time: 1951
MidPeriod: 1951.5
PopMale: 1290237.638
PopFemale: 1293796.589
PopTotal: 2584034.227
PopDensity: 19.863
LocID: 900
Location: World
VarID: 2
Variant: Medium
Time: 1952
MidPeriod: 1952.5
PopMale: 1313854.565
PopFemale: 1317007.125
PopTotal: 2630861.69
PopDensity: 20.223for letter, number, word in zip(['a', 'b', 'c'], ['1', '2', '3','4'], ['this', 'is', 'cool']):
print(letter, number, word)
print(list(zip('abc', '123')))
print(list(range(10))) a 1 this
b 2 is
c 3 cool
[('a', '1'), ('b', '2'), ('c', '3')]
[0, 1, 2, 3, 4, 5, 6, 7, 8, 9]for letter, number in zip('abc', '123'):
print(letter, number)Joining the header and the values together seems useful.
Can we write a function that does that for us?
def read_csv(filename):
    with open(filename, 'rt') as file:
        reader = csv.reader(file)
        header = next(reader)
        records = []
        for line in reader:
            record = {}
            for name, value in zip(header, line):
                record[name] = value
            records.append(record)

    return records
records = read_csv("world-population.csv")
records[:2] [{'LocID': '900',
'Location': 'World',
'VarID': '2',
'Variant': 'Medium',
'Time': '1950',
'MidPeriod': '1950.5',
'PopMale': '1266259.556',
'PopFemale': '1270171.462',
'PopTotal': '2536431.018',
'PopDensity': '19.497'},
{'LocID': '900',
'Location': 'World',
'VarID': '2',
'Variant': 'Medium',
'Time': '1951',
'MidPeriod': '1951.5',
'PopMale': '1290237.638',
'PopFemale': '1293796.589',
'PopTotal': '2584034.227',
'PopDensity': '19.863'}]records[8] {'LocID': '900',
'Location': 'World',
'VarID': '2',
'Variant': 'Medium',
'Time': '1958',
'MidPeriod': '1958.5',
'PopMale': '1462864.322',
'PopFemale': '1462822.358',
'PopTotal': '2925686.68',
'PopDensity': '22.489'}Looking up all the data for single entry is easy.
How would I pull out all the values for a specific column?
def select_values(records, name):
    values = []
    for record in records:
        values.append(record[name])
    return values
total_pop = select_values(records, "PopTotal")
total_pop[:5] ['2536431.018', '2584034.227', '2630861.69', '2677609.061', '2724846.754']years = select_values(records, 'Time')
years[:5] ['1950', '1951', '1952', '1953', '1954']plt.plot(years, total_pop)
plt.title("Total Population") Text(0.5, 1.0, 'Total Population')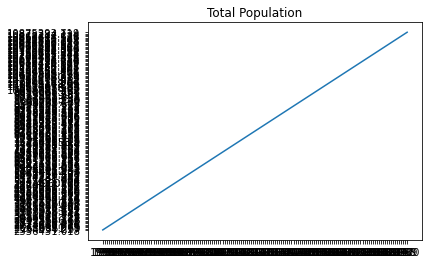
🤨
plt.plot(['a', 'b', 'c', 'd'], ['x', 'y', 'z', 'x']) [<matplotlib.lines.Line2D at 0x11e7845b0>]
While that feature is cool, that’s not quite what we wanted in our scenario.
We want to convert the string values into integers and floating-point numbers.
def select_values_as_int(records, name):
values = []
for record in records:
values.append(int(record[name]))
return valuesdef select_values_as_float(records, name):
values = []
for record in records:
values.append(float(record[name]))
return valuesdef select_values(records, name, transform):
values = []
for record in records:
values.append(transform(record[name]))
return valuestotal_pop = select_values(records, 'PopTotal', float)
years = select_values(records, 'Time', int)plt.plot(years, total_pop)
plt.title("Total Population") Text(0.5, 1.0, 'Total Population')
records = read_csv("world-population.csv")
total_pop = select_values(records, 'PopTotal', float)
years = select_values(records, 'Time', int)
plt.plot(years, total_pop)
plt.title("Total Population")
Text(0.5, 1.0, 'Total Population')
We call this approach the record model.
We have a list of dictionaries, each dictionary represents a row in the table.
Now, there is another way to parse a CSV.
What if, instead of getting a list of dictionaries (i.e. rows), we got a dictionary of lists (i.e. columns)?
def read_csv(filename):
    with open(filename, 'rt') as file:
        reader = csv.reader(file)
        data = {}

        header = next(reader)
        for name in header:
            data[name] = []

        for line in reader:
            for name, value in zip(header, line):
                data[name].append(value)

    return data
data = read_csv("world-population.csv")for name, values in data.items():
print(f"{name}: {values[:5]}") LocID: ['900', '900', '900', '900', '900']
Location: ['World', 'World', 'World', 'World', 'World']
VarID: ['2', '2', '2', '2', '2']
Variant: ['Medium', 'Medium', 'Medium', 'Medium', 'Medium']
Time: ['1950', '1951', '1952', '1953', '1954']
MidPeriod: ['1950.5', '1951.5', '1952.5', '1953.5', '1954.5']
PopMale: ['1266259.556', '1290237.638', '1313854.565', '1337452.786', '1361313.834']
PopFemale: ['1270171.462', '1293796.589', '1317007.125', '1340156.275', '1363532.92']
PopTotal: ['2536431.018', '2584034.227', '2630861.69', '2677609.061', '2724846.754']
PopDensity: ['19.497', '19.863', '20.223', '20.582', '20.945']def read_csv(filename, transforms):
with open(filename, 'rt') as file:
reader = csv.reader(file)
data = {}
header = next(reader)
for name in header:
data[name] = []
for line in reader:
for name, value in zip(header, line):
transform = str
if name in transforms:
transform = transforms[name]
data[name].append(transform(value))
return datatransforms = {
'PopTotal': float,
'Time': int,
'PopMale': float,
'PopFemale': float,
'PopDensity': float
}
data = read_csv("world-population.csv", transforms)for name, values in data.items():
print(f"{name}: {values[:5]}") LocID: ['900', '900', '900', '900', '900']
Location: ['World', 'World', 'World', 'World', 'World']
VarID: ['2', '2', '2', '2', '2']
Variant: ['Medium', 'Medium', 'Medium', 'Medium', 'Medium']
Time: [1950, 1951, 1952, 1953, 1954]
MidPeriod: ['1950.5', '1951.5', '1952.5', '1953.5', '1954.5']
PopMale: [1266259.556, 1290237.638, 1313854.565, 1337452.786, 1361313.834]
PopFemale: [1270171.462, 1293796.589, 1317007.125, 1340156.275, 1363532.92]
PopTotal: [2536431.018, 2584034.227, 2630861.69, 2677609.061, 2724846.754]
PopDensity: [19.497, 19.863, 20.223, 20.582, 20.945]plt.plot(data['Time'], data['PopTotal'])
plt.title("Total Population") Text(0.5, 1.0, 'Total Population')
transforms = {
    'PopTotal': float,
    'Time': int,
    'PopMale': float,
    'PopFemale': float,
    'PopDensity': float
}
data = read_csv("world-population.csv", transforms)
plt.plot(data['Time'], data['PopTotal'])
plt.title("Total Population")
Text(0.5, 1.0, 'Total Population')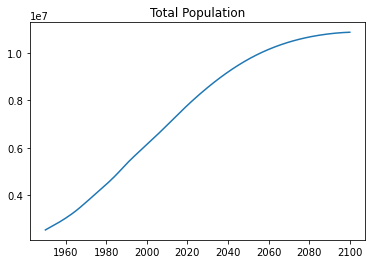
Now, getting whole columns is really easy.
How can I get individual records?
def get_record(data, index):
    record = {}
    for name, values in data.items():
        record[name] = values[index]
    return record
get_record(data, 8) {'LocID': '900',
'Location': 'World',
'VarID': '2',
'Variant': 'Medium',
'Time': 1958,
'MidPeriod': '1958.5',
'PopMale': 1462864.322,
'PopFemale': 1462822.358,
'PopTotal': 2925686.68,
'PopDensity': 22.489}We call this the dataframe model.
We have a dictionary of lists, each list representing a column in the table.
Key Ideas
- When reading CSVs (or other tabular data), we will typically use either the
record model or the dataframe model.
- The record model is to store the data as a list of dictionaries, each dictionary representing a row or record.
- The dataframe model is to store the data as a dictionary of lists, each list representing a column or series.
zipis pretty handy- We can pass functions as arguments to other functions!
What did you learn today?
What styles were more intuitive to you?
What approaches seem more useful to you? Why?