
Project 7 — Baby Names and Student Ratings
In this project you will parse data into dictionaries and then create graphs based on this data using matplotlib. To get started, download project7.zip.
Part 1: Baby Names
For this part, you will write your code in the babynames.ipynb Python
notebook. You’ll be parsing data using the files in the babynames directory:
- baby-1900.txt
- baby-1910.txt
- baby-1920.txt …
- baby-2020.txt
Data Format
Each of these files has the following structure:
1900
1,John,Mary
2,William,Helen
3,James,Anna
4,George,Margaret
5,Charles,Ruth
6,Robert,Elizabeth
The first line is the year. The rest of the lines give a rank, a male name, and a female name. For example, the above snippet shows that the most popular name in 1900 for a boy was John and for a girl it was Mary. The second most popular names were William and Helen.
We also have some sample files for testing:
- small-2000.txt
- small-2010.txt
Dictionary
You will be be reading all of this data into a names_dict dictionary. This
dictionary has the following structure:
- the key is a name
- the value is a dictionary
- this dictionary has a key that is a year
- the value is the rank
For example:
{'Abe': {2000: 10}, 'Alex': {2000: 1, 2001: 2}}This shows that Abe was ranked 10th most popular in 2000. Alex was ranked the 1st most popular in 2000 and the 2nd most popular in 2001.
Doctests
As we work on this problem, we will provide you with function definitions, documentation, and doctests.
When you run your code, the doctests will automatically run using a line like this:
doctest.run_docstring_examples(add_name, globals())This tells the notebook to run the docstring tests for the add_name()
function.
If there is no output when you run the cell with the doctests, your code is correct. If there are errors, the output will show what was expected and what your function returned instead.
Code
Now you’re ready to write your code in babynames.ipynb.
Bias in Student Ratings
For this part, you will write your code in the studentratings.ipynb Python
notebook. We will be using data in the student-ratings directory. This
includes small-data.txt for testing and full-data.txt for plotting.
Introduction
You will analyze a historical dataset consisting of nearly 20 years of reviews of college and university professors posted on RateMyProfessors.com, a popular review aggregation website. Teacher ratings are a common and impactful facet of life in university – here at BYU, we fill out course reviews at the end of every semester. Student reviews are often used by professors to improve how they are teaching a class. They are also frequently used in promotion and tenure cases, to decide whether a professor is hired or fired.
However, teaching evaluations are not an objective source of truth about the quality of a professor’s teaching. Recent research has shown that teaching evaluations often demonstrate harmful biases, including gender bias. The bias in teaching evaluations is a problem because the scores are often used in decisions about who to hire, fire, tenure, and promote. Your goal is to build a piece of software that helps you investigate and reason about how humans use language in gendered (and potentially biased) ways.
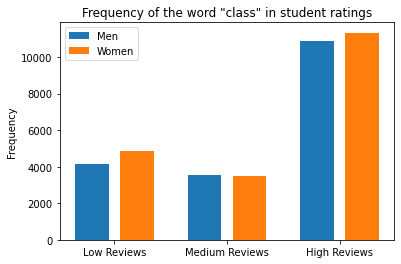
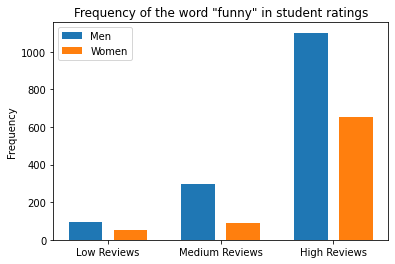
Here are two of the graphs you will create:
Background
Before we get started coding, we first want to provide you with some background about why being able to investigate and identify biases in datasets is such an important problem to solve. Much of today’s work in artificial intelligence involves natural language processing, a field which studies the way language is used today and has been used in the past. The datasets we use to train artificially intelligent systems are usually collections of text that humans have written at some point in the past. If there are imbalances in how different groups of people tend to be described or represented in these datasets, then our machines will pick up on and potentially amplify those imbalances. Extreme manifestations of these biases like Tay, Microsoft’s 2016 chatbot infamous for tweeting racist and anti-Semitic statements after just a day of learning from anonymous posts on the Internet, magnify the importance of understanding the ways we use language. More recent examples include Amazon’s AI tool for expediting hiring and recruiting, which was shut down after demonstrating extreme negative bias towards hiring candidates based on their gender.
Even when people do not mean to be malicious, their language can still exhibit biases that influence how our machines learn. For example, when history of science professor Londa Schiebinger attempted to Google Translate a Spanish article written about her, all of the pronouns became “he” and “him” rather than “she” and “her” simply because masculine pronouns were more common than feminine pronouns in the available data. In a later study, Schiebinger found more insidious translation errors that assumed genders for people of certain professions, based on the frequency of word usage in gendered languages such as German. The software engineers who made Google Translate probably did not mean for this to occur; they probably did not even account for that possibility as they were designing their translation algorithm. The moral of the story? To prevent these kinds of slip-ups, computer scientists need to consider the social impacts of their work at the beginning of their design process.
Identifying issues of bias and representation in datasets is an important topic in computing. Our hope is that by introducing this topic early in computer science education, we can help the next generation of software developers and computer science researchers—which could include you!—be more mindful of the potential social implications of their work.
Student Ratings
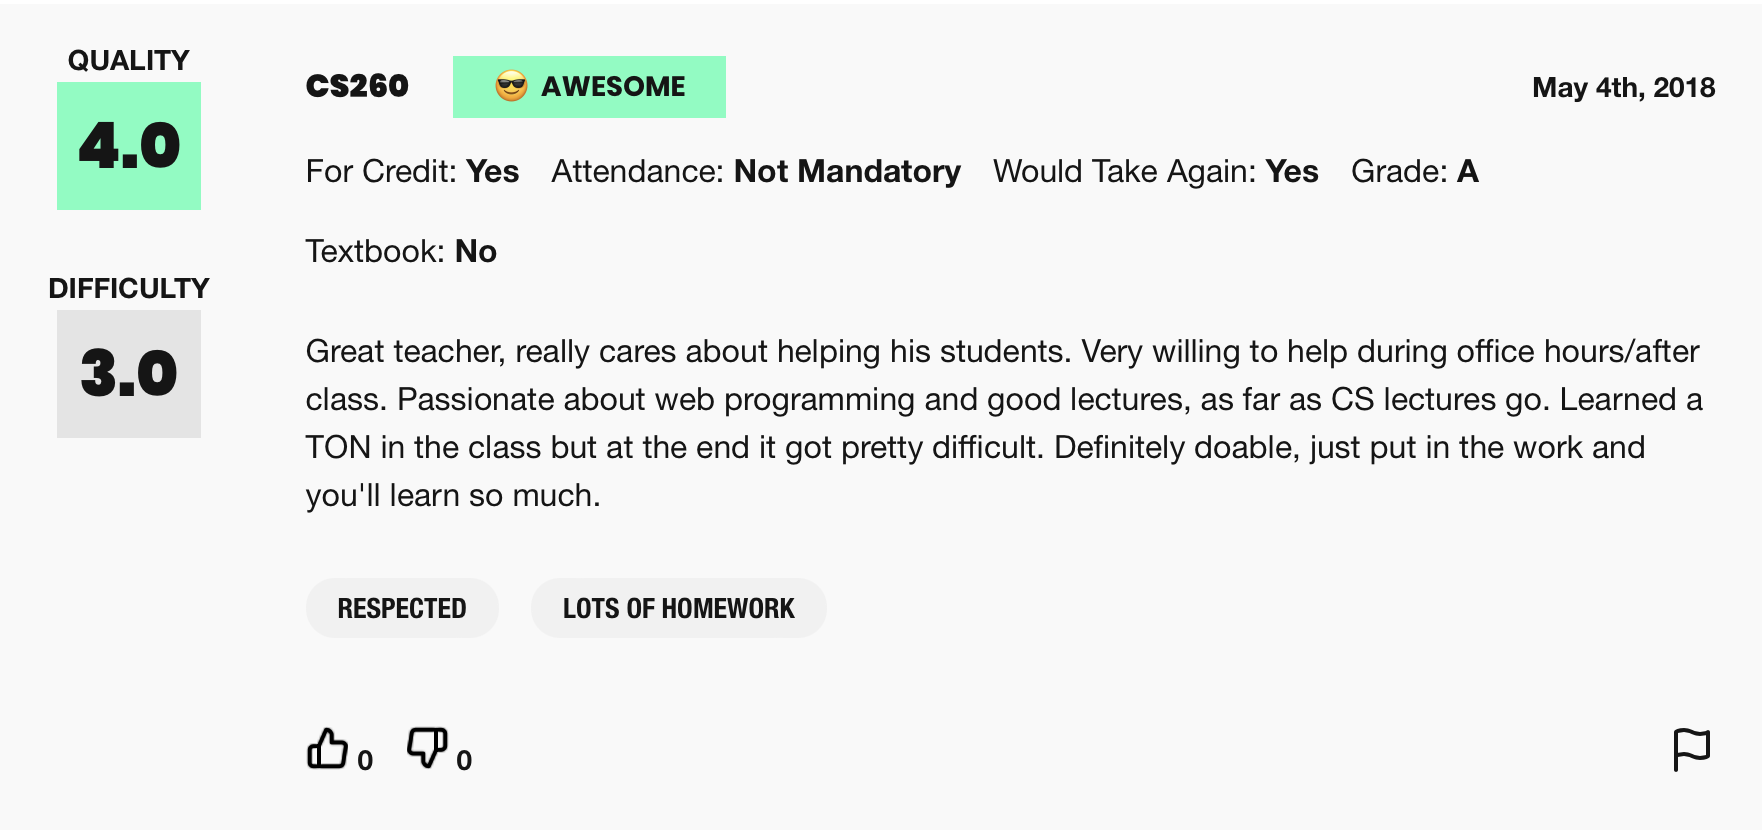
This assignment uses real world data from RateMyProfessors.com, an online platform that enables students to leave anonymous, public reviews about their college/university professors. A typical review on RateMyProfessors.com consists of an overall numerical rating of quality (from 1-5), a number of qualitative tags (like “amazing lectures” or “difficult exams”), and a free-response comment section where students can write a short paragraph describing their experience with the professor. An example review is shown below:
The power of the Internet makes this platform for reviews accessible to the global community of students, empowering students to make decisions about classes they might want to take or universities they might want to attend based on the quality of instruction. The indirectness and anonymity of being behind a computer or phone screen also gives people a sense of security to say whatever they want, which can range from the supportive or constructive to the downright offensive or harmful. In analyzing this dataset you will be working to answer the following question: does a professor’s gender influence the language people use to describe them?
To examine this question, we are using a dataset of 20,000 reviews from RateMyProfessors.com that was compiled by Stanford University. These reviews were posted over a 17-year span from 2001 to 2018. The dataset has been cleaned and organized into one large text file that you will parse. There are three important components of every review that we have used to build the dataset: gender of the professor being reviewed, textual content of the free-response comment, and overall rating (a numerical score from 1-5).
A note on gender vs sex: In this dataset, gender is the only piece of information we have about these people’s social identities; the dataset does not include other salient identities such as race and ability. Furthermore, gender is only classified into the categories of woman and man, which means non-binary people are unfortunately not represented. The dataset describes the two genders as “woman” and “man” rather than “female” and “male,"" as the former terms refer to gender and social role whereas the latter typically refer to sex assigned at birth. Professors do not have the opportunity to describe their own gender identity; this data represents the guesses of students.
Data Format
These files have the following structure:
Rating,Professor Gender,Comment Text
5.0,W,jans is great she is a fantastic teacher and her class was both interesting and lively she does expect you to read a lot out of the book and other sources as well she is a very lively teacher and you can tell she loves the subject she teaches
1.0,M,this teacher will not inspire you to be a better programmer he takes pride in deducting as many points as possible do you want to get on an assignment because you forgot to comment the number and use correct naming conventions even though your program runs this professor is for you
2.0,W,i took her for research methods and had to drop her class half way nice lady but veryyyyy tough grader and gives you an f even if you do the work i had fs even though i did my work and gave everything on time usually gives assignments and the final research project the lectures are pretty long overall i do not reccomend
Dictionary
You will be be reading all of this data into a word_data dictionary. This
dictionary has the following structure:
- the key is a word
- the value is a dictionary
- this dictionary has a key that is ‘M’ for man and ‘W’ for woman
- the value is a list of the number of student reviews that mention this word, split into counts for low reviews, medium reviews, and high reviews.
For example, the dictionary could contain:
{
  'great': {
      'W': [30, 100, 800],
      'M': [100, 200, 1500]
  },
  'teacher': {
      'W': [330, 170, 852],
      'M': [402, 250, 1194]
  }
}
You can see that this is a nested dictionary. In the first dictionary, the keys are words found in reviews, such as ‘great’ and ‘teacher’. The value for this dictionary is another dictionary. In this second dictionary, the keys are ‘W’ and ‘M’, standing for woman and man, and the values are a list of the number of low reviews, the number of medium reviews, and the number of high reviews.
To determine whether a rating is “low”, “medium”, or “high”, we convert the numerical rating a student gives (a float) into a 0 (low), 1 (medium), or 2 (high). We do this as follows:
-
reviews with a numerical rating of less than 2.5 are considered “low reviews” and assigned a 0
-
reviews with a numerical rating between 2.5 and 3.5 (inclusive on both ends of range) are considered “medium reviews” and assigned a 1
-
reviews with a numerical rating above 3.5 are considered “high reviews” and are assigned a 2
If we access word_data["great"] we get an inner dictionary that looks like
this:
{
  'W': [30, 100, 800],
  'M': [100, 200, 1500]
}
If we access word_data["great"]["W"] we get the list of counts:
[30, 100, 800]This means 30 “low” reviews used the word great, 100 “medium” reviews used the
word great, and 800 “medium” reviews used the word “great”.
If we want to increment one of these counts, we could use:
word_data["great"]["W"][2] += 1Doctests
As we work on this problem, we will provide you with function definitions, documentation, and doctests. When you run your code, the doctests will automatically run.
If there is no output, your code is correct. If there are errors, the output will show what was expected and what your function returned instead.
Code
Now you’re ready to write your code in studentratings.ipynb.
Submit
Before submitting your Python notebooks, select Cell->Run All to be sure
everything works properly.
You need to submit:
babynames.ipynbstudentratings.ipynb
Points
This project is worth 100 points.
| Task | Description | Points |
|---|---|---|
| Baby Names | ||
| add_name() | Your solution works | 10 |
| add_file() | Your solution works | 10 |
| read_files() | Your solution works | 10 |
| search_names() | Your solution works | 10 |
| get_years_and_ranks() | Your solution works | 10 |
| Plots of Daniel/Gordon, Emma/Amy, Jen, your own plot | Your plots work | 10 |
| Student Ratings | ||
| add_data_for_word() | Your solution works | 10 |
| read_file() | Your solution works | 10 |
| plot_word() | Your solution works | 10 |
| Plots of class, and your own plots | Your plots work | 10 |
| Ethics and science questions | You engaged with the questions meaningfully | 10 |
Credits
This assignment is based on assignments used in CS 106A at Stanford.